Getting Started - Guided tour of the creation of a new OpenSilver application
The development experience with OpenSilver is very similar to that of Silverlight, WPF, and Universal Platform. You can use Visual Studio on Windows (recommended) or VS Code on Windows, macOS, or Linux.
Option 1: Using the CLI and VS Code (for Windows, macOS, or Linux)
Please refer to the VS Code Support page.
Option 2 (Recommended): Using Visual Studio on Windows
OpenSilver is distributed as a NuGet package (on NuGet.org) and as a VSIX extension for Visual Studio containing the project templates.
To create a new OpenSilver-type project, it is recommended to download the project templates first. To do that, go to https://OpenSilver.NET , click Download, log in with your Microsoft account, and download the OpenSilver.VSIX file. This extension for Visual Studio will install project templates and other elements like the XAML editor.
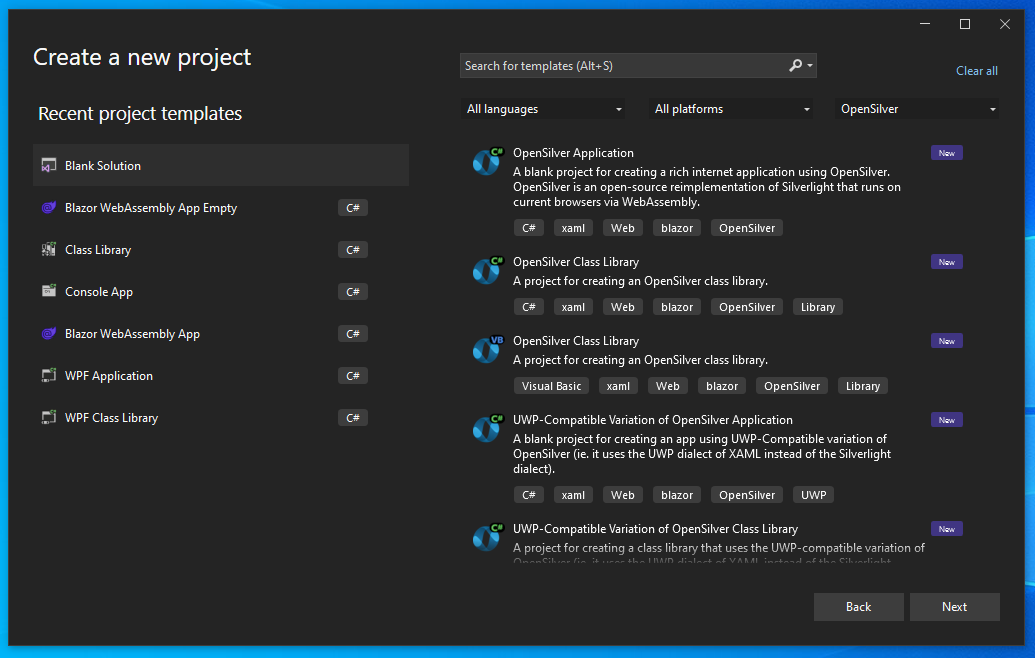
Next, open Visual Studio and click on "Create a new project" and choose "OpenSilver Application".
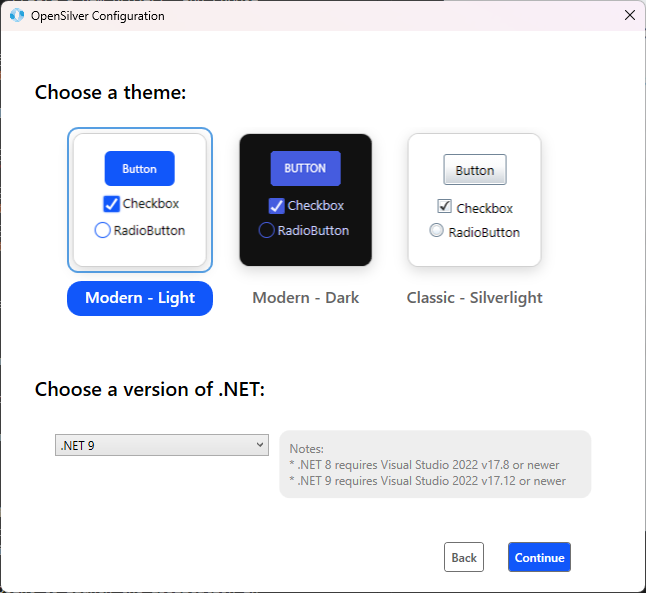
Next, choose the UI Theme and .NET version.
Once the solution is created, you will see that it has three projects.
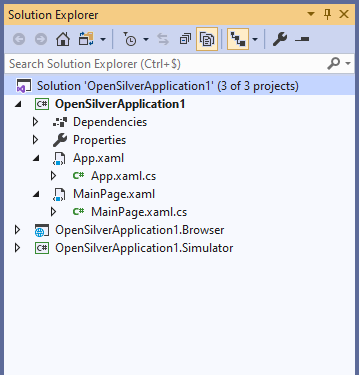
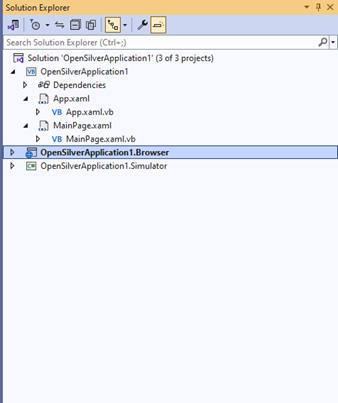
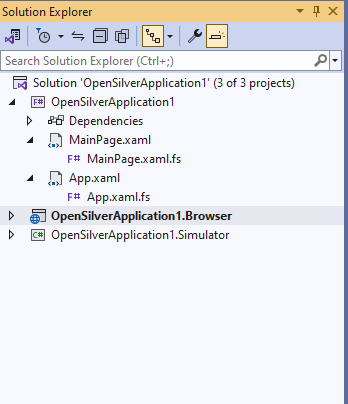
The first one is where you will place the files for your application. Its structure is identical to that of a new Silverlight project. It notably contains the files:
* For C# code migration :- App.xaml, App.xaml.cs, MainPage.xaml and MainPage.xaml.cs.
* For VB.NET code migration :- App.xaml, App.xaml.vb, MainPage.xaml and MainPage.xaml.vb.
* For F# code migration :- App.xaml, App.xaml.fs, MainPage.xaml and MainPage.xaml.fs.
The second project, named with the suffix ".Browser", is the one you will have to launch to test your application in the browser. It plays a role similar to the ".Web" project that existed for Silverlight applications. This is an ASP.NET Blazor Client-Side project. This project references the first project and serves as an entry point to launch the application in WebAssembly.
Finally the third project, named with the suffix ".Simulator" is the one that you will have to launch to test your application in the Simulator. We will talk more about the Simulator later. Its main interest is to allow debugging with the very powerful tools of the .NET Framework, such as the possibility of moving the execution point or executing C# (or VB.NET or F#) code at runtime in the "Immediate" window, things that are not possible in the browser.
As a test, let's create a Button in our OpenSilver application:
- Add the following XAML code inside the MainPage.xaml file, replacing the
<Grid>element:
    <StackPanel HorizontalAlignment="Left" Margin="10">
        <TextBlock Text="Enter some text below:" FontSize="14"/>
        <TextBox x:Name="MyTextBox1" Margin="5"/>
        <Button Content="Click me" Click="Button_Click"/>
    </StackPanel>
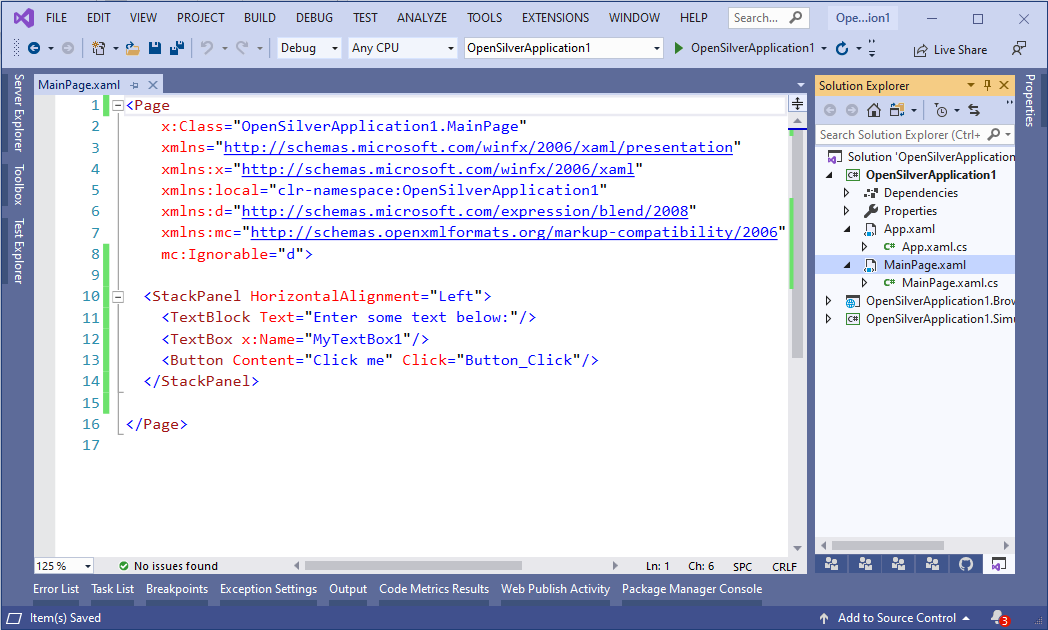
Note: OpenSilver 3.0 introduced an enhanced drag-and-drop UI designer that shows a preview of XAML pages and allows to develop your app quickly.
- Add the following code:
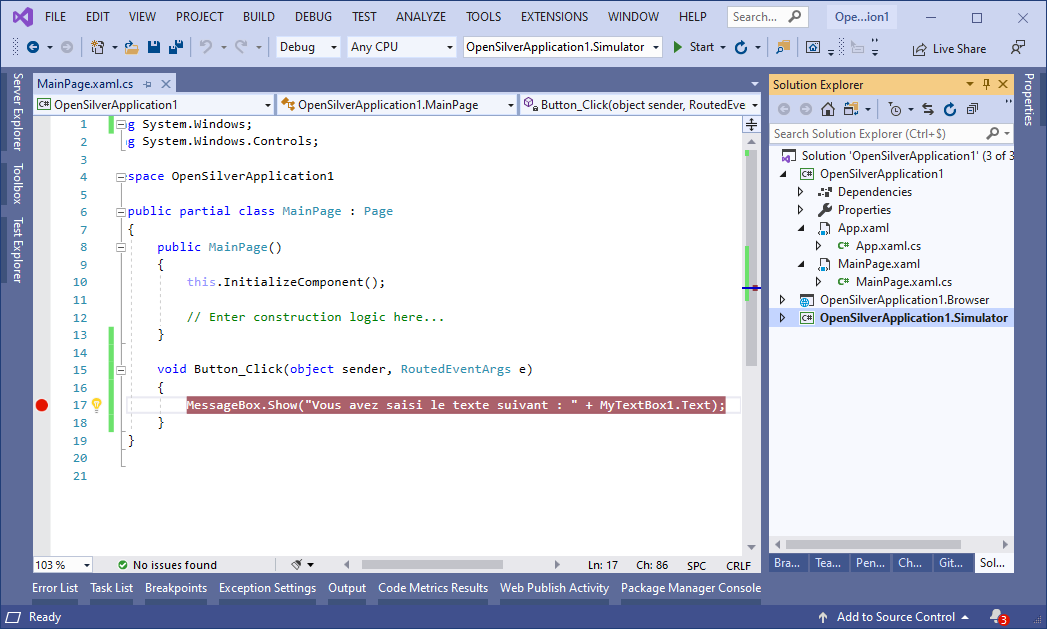
- In C#
Inside the MainPage.xaml.cs file:
			void Button_Click(object sender, RoutedEventArgs e)
			{
			    MessageBox.Show("You entered the following text: " + MyTextBox1.Text);
			}
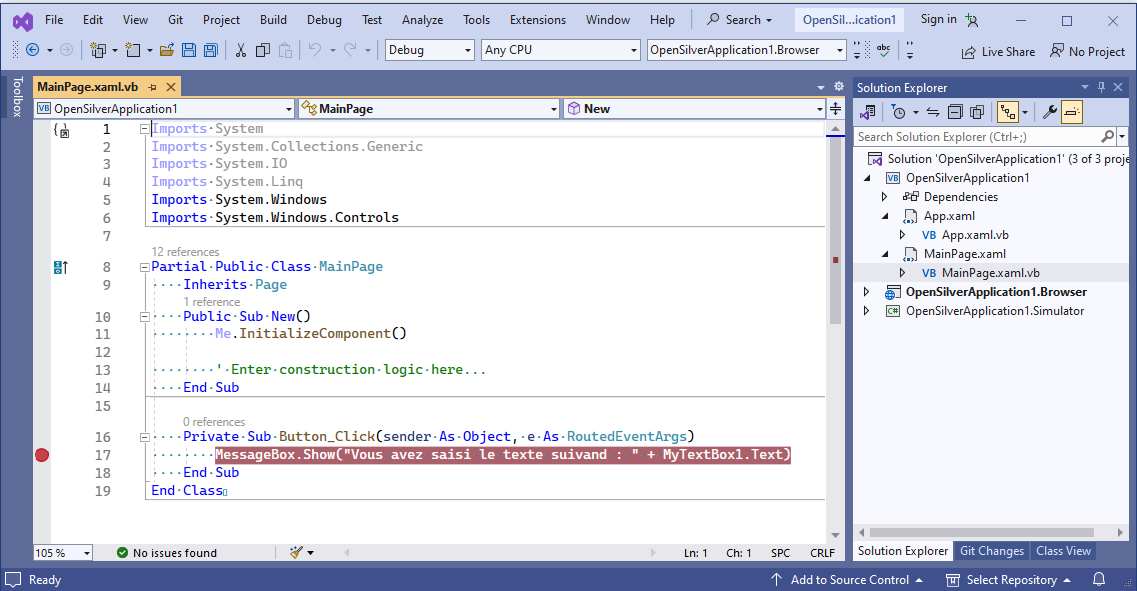
- In VB.NET
Inside the MainPage.xaml.vb file:
			Private Sub Button_Click(sender As Object, e As RoutedEventArgs)
			    MessageBox.Show("You entered the following text: " + MyTextBox1.Text)
			End Sub
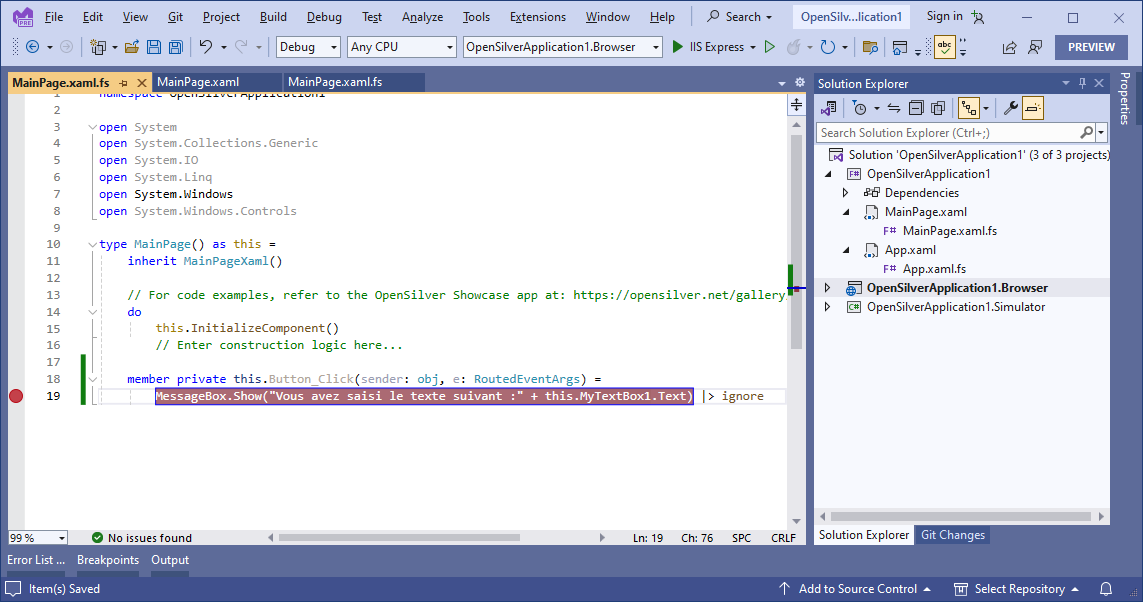
- In F#
Inside the MainPage.xaml.fs file:
            member private this.Button_Click(sender: obj, e: RoutedEventArgs) =
                MessageBox.Show("Vous avez saisi le texte suivant :" + this.MyTextBox1.Text) |> ignore
Now that the modifications are done, we can test our application.
Let's recompile the solution and launch the project with the suffix ".Browser". The default browser opens and the application runs.
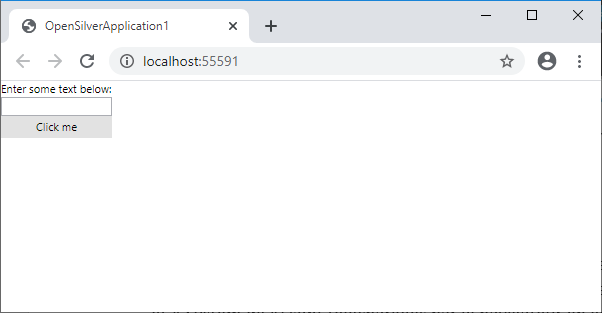
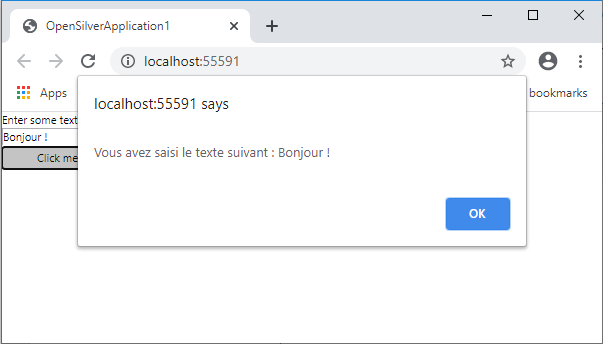
Now, if we enter some text and press the button. A dialog box will appear with the text entered.
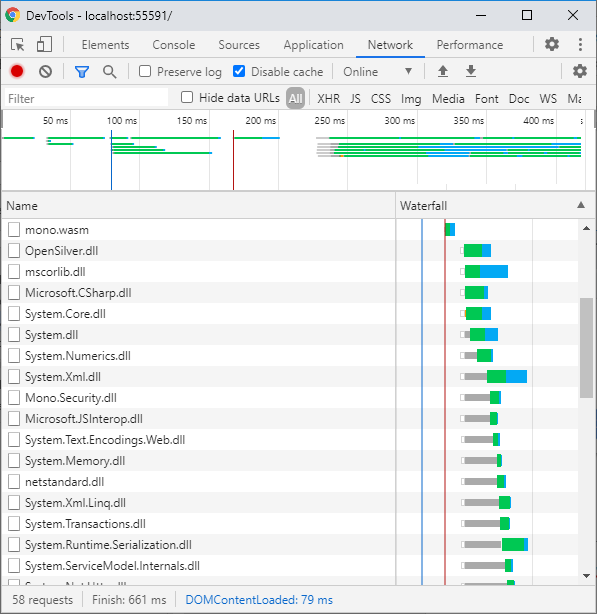
To see that the application runs in WebAssembly (currently in interpreted mode), we can go to the browser development tools (Chrome in this example) by pressing the F12 key, then go to the "Network" tab and refresh the page by pressing F5. Microsoft .NET assemblies (such as "mscorlib.dll" and "System.dll") are downloaded by the browser instead of JavaScript files.
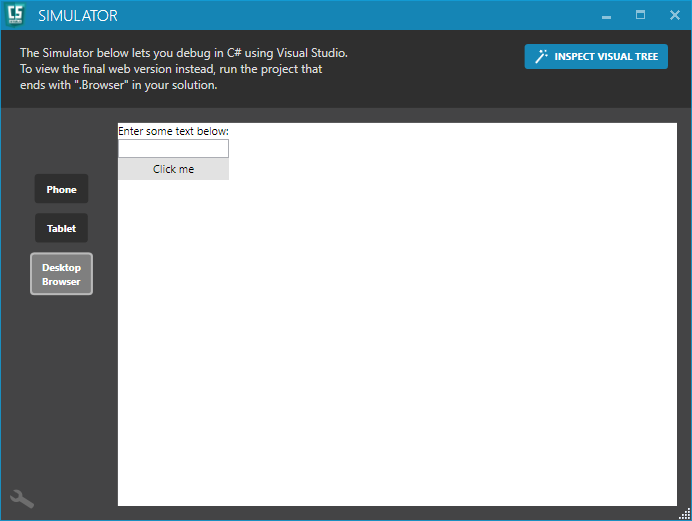
Now let's go back to Visual Studio and launch the project with the suffix ".Simulator"
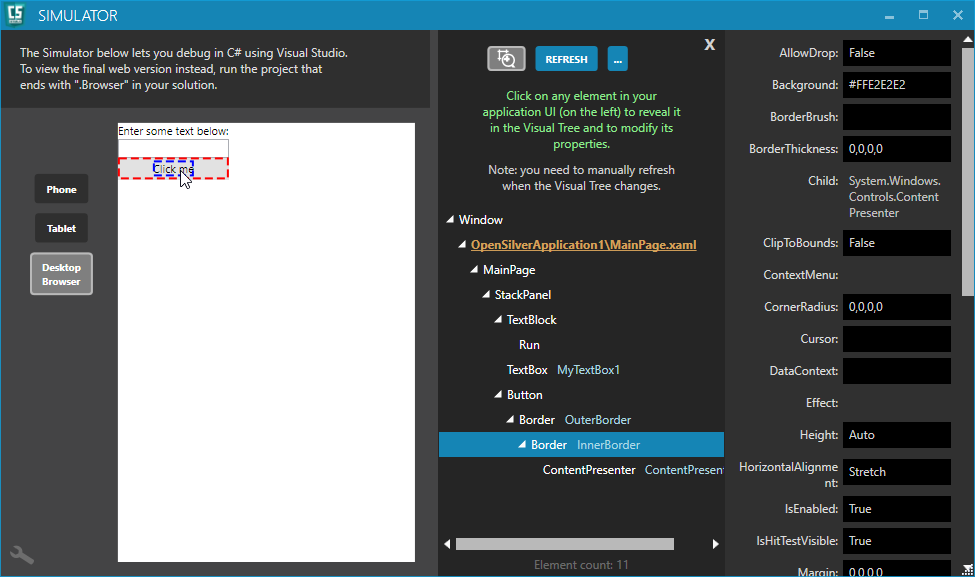
The simulator appears and shows the application. Like before, we can enter some text and click the button to make a dialog box appear.
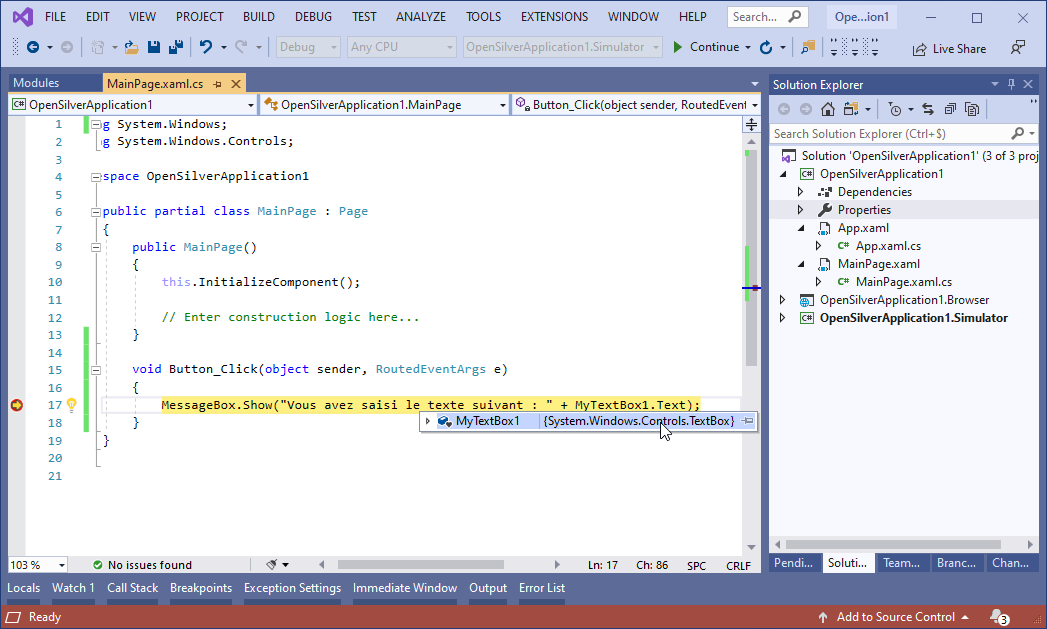
Let's put a breakpoint inside the Button_Click method, then press the button. It is possible to inspect the variables and to do step-by-step debugging.
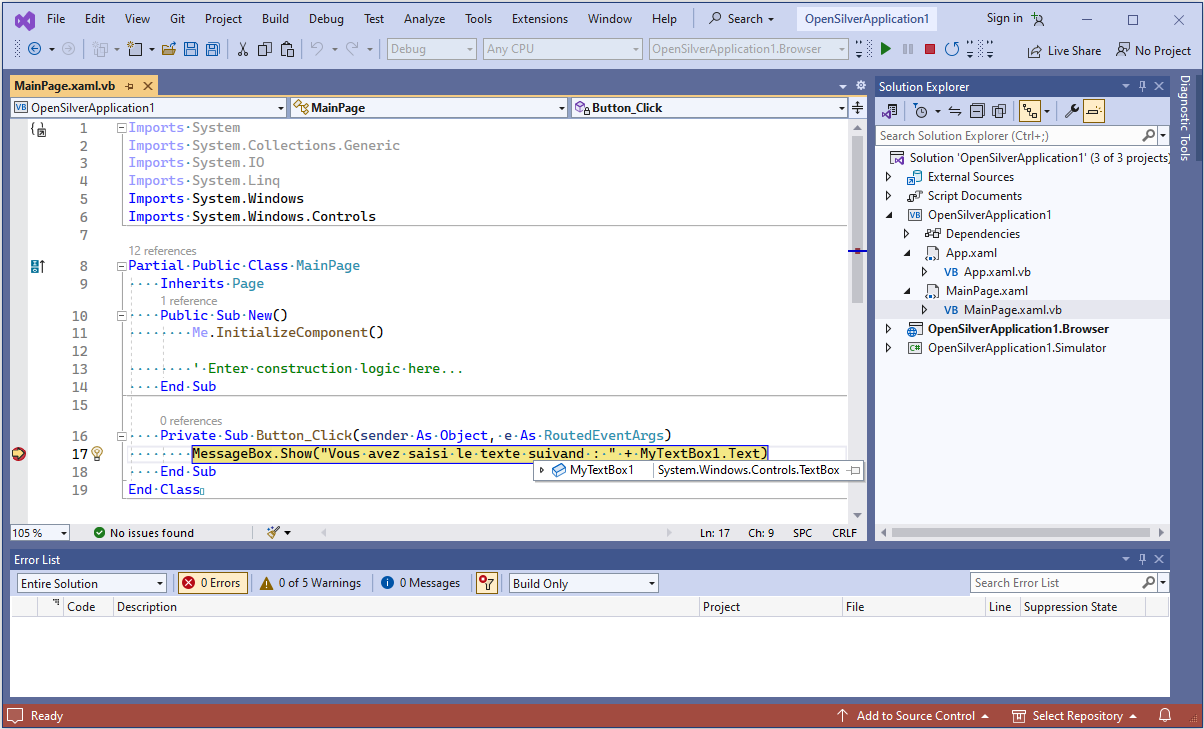
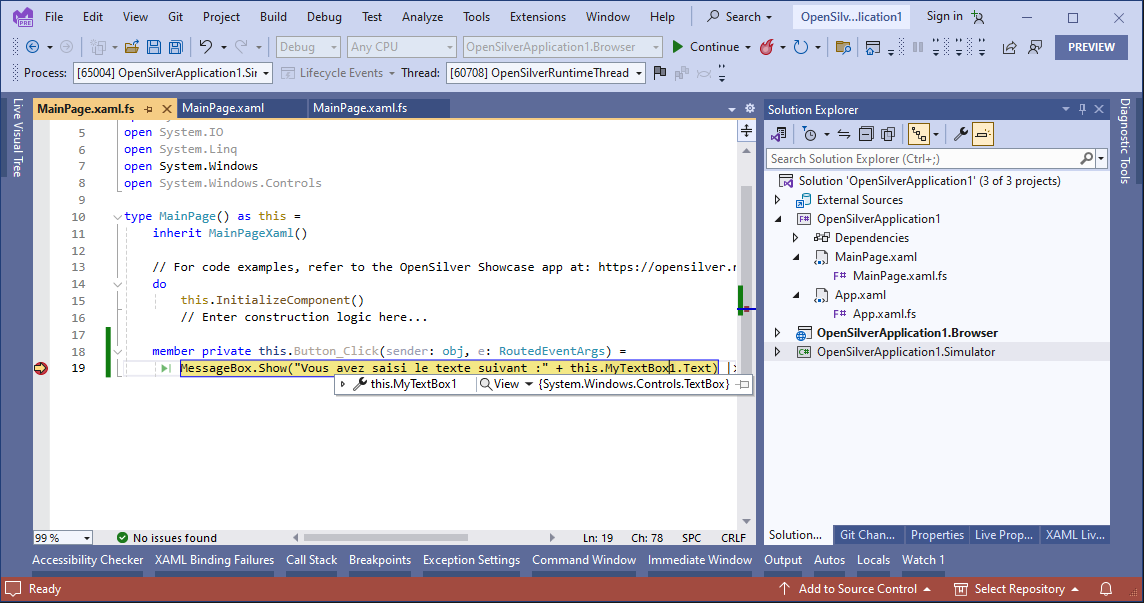
Once done, press the F5 key to continue.
In the Simulator window, there is an "Inspect Visual Tree" button in the top right corner. Pressing it will open a panel letting you explore the visual tree that constitutes the UI of the application.
