Debug OpenSilver applications in Browser
It is possible to Debug OpenSilver applications directly in Browser instead of using Visual Studio debugger. The C# code will be shown in Sources tab.
Here are the steps:
Build the application using Debug configuration
Start the application without Debugging (Ctrl-F5)
After the app starts press Shift-Alt-D
It will open a new tab where it suggests the full command to run the app in debug mode
edge --remote-debugging-port=9222 --user-data-dir="C:\Users\ashot\AppData\Local\Temp\blazor-chrome-debug" http://localhost:55591/
edge can be replaced with chrome
This step can be skipped actually if we know the command and application url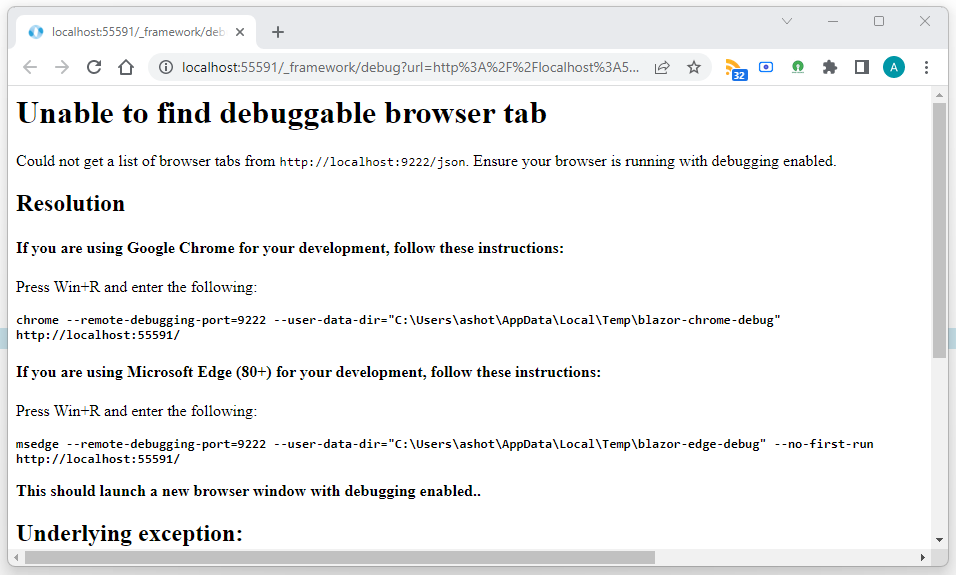
Press Win+R and enter the full command
That should launch a new browser window with debugging enabled.When the app is running in a new window press Shift-Alt-D again
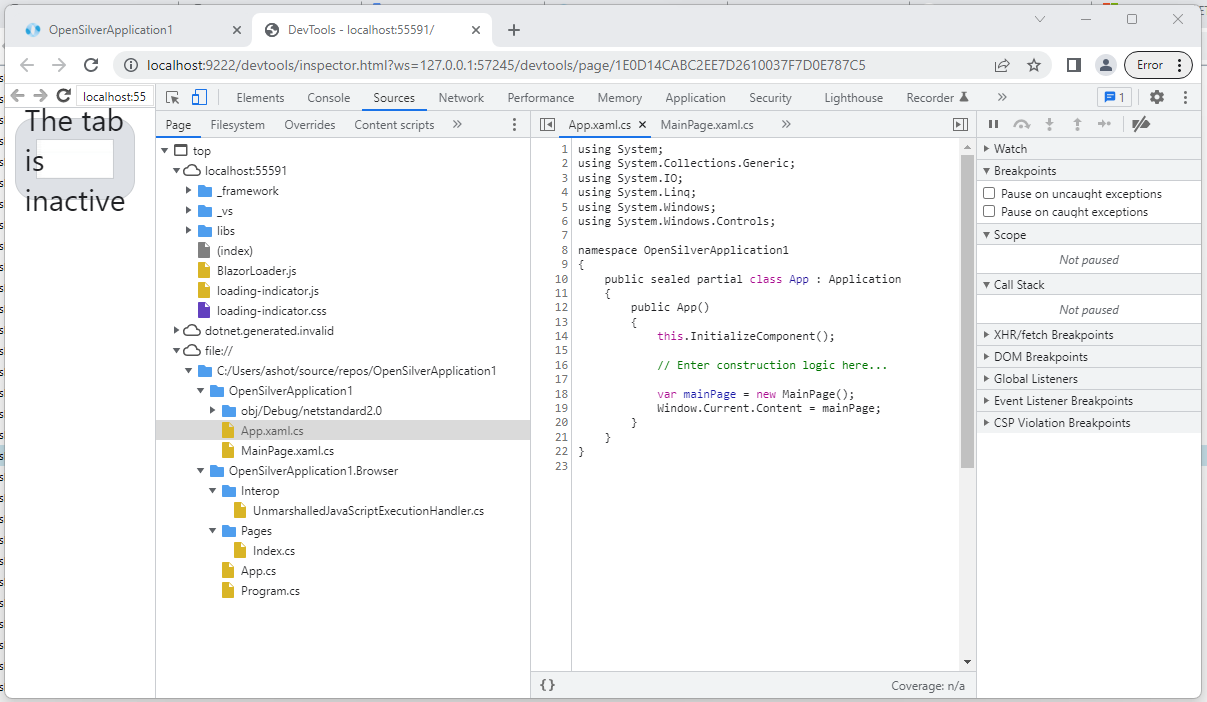
Navigate to Sources tab and make sure you can see C# source code
First tab is used to interact with the application and the second tab is used for breakpoints.