Use Visual Studio Performance Profiler for OpenSilver projects.
.NET profiling tools can be used to analyze OpenSilver application performance including CPU usage, Memory Usage and other available analysis Visual Studio provides.
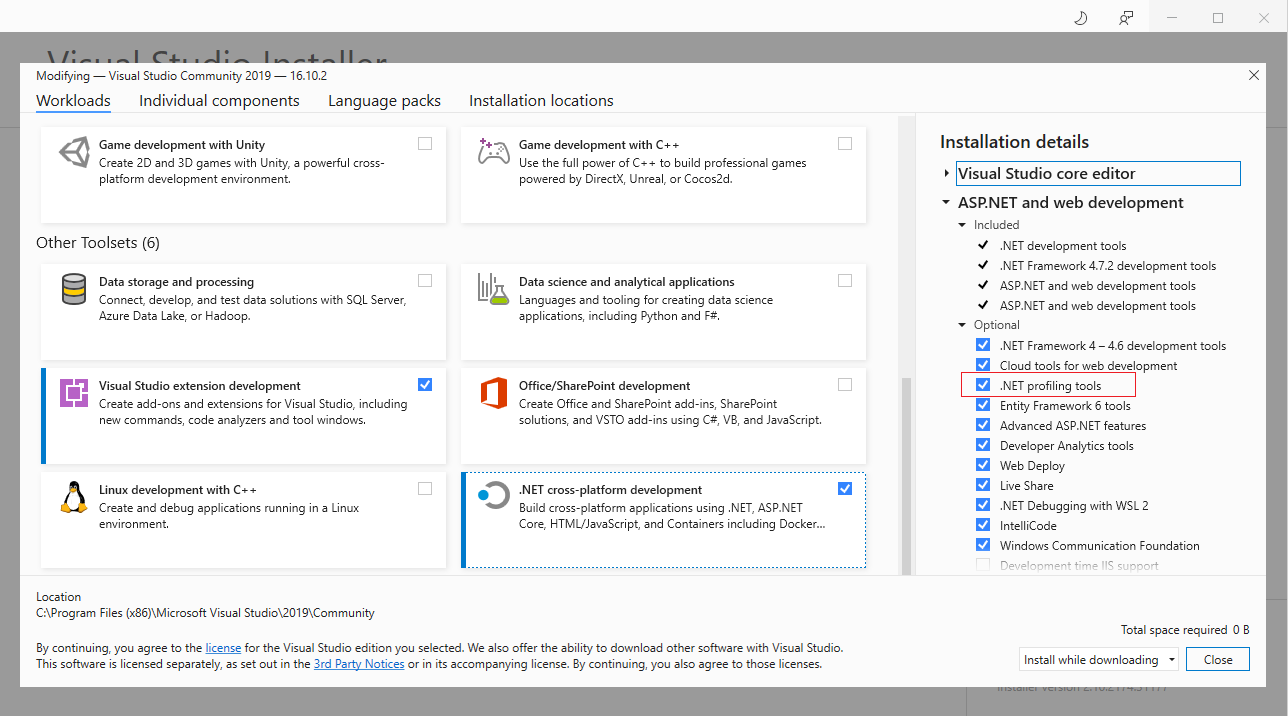
1. Install profiling tools
By default profiling tools are installed with Visual Studio. If that's not the case then it can be installed using Visual Studio Installer.
2. Use latest Simulator project
.Simulator project needs to be set as Startup Project in order to be able to use profiler. As an addition simulator project needs to be updated to the latest version which means it needs to run as a standalone executable Windows Application.
Here are full instructions.
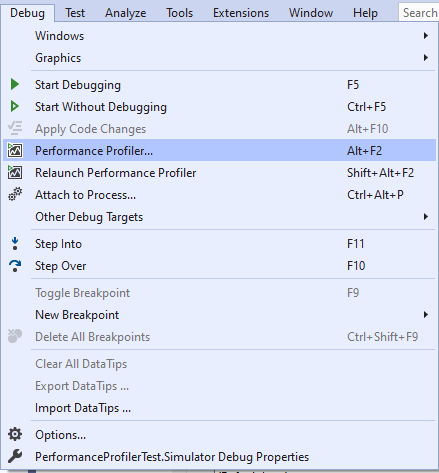
3. Run profiler
If the above mentioned points are satisfied then to run profiler go to Debug -> Performance Profiler...
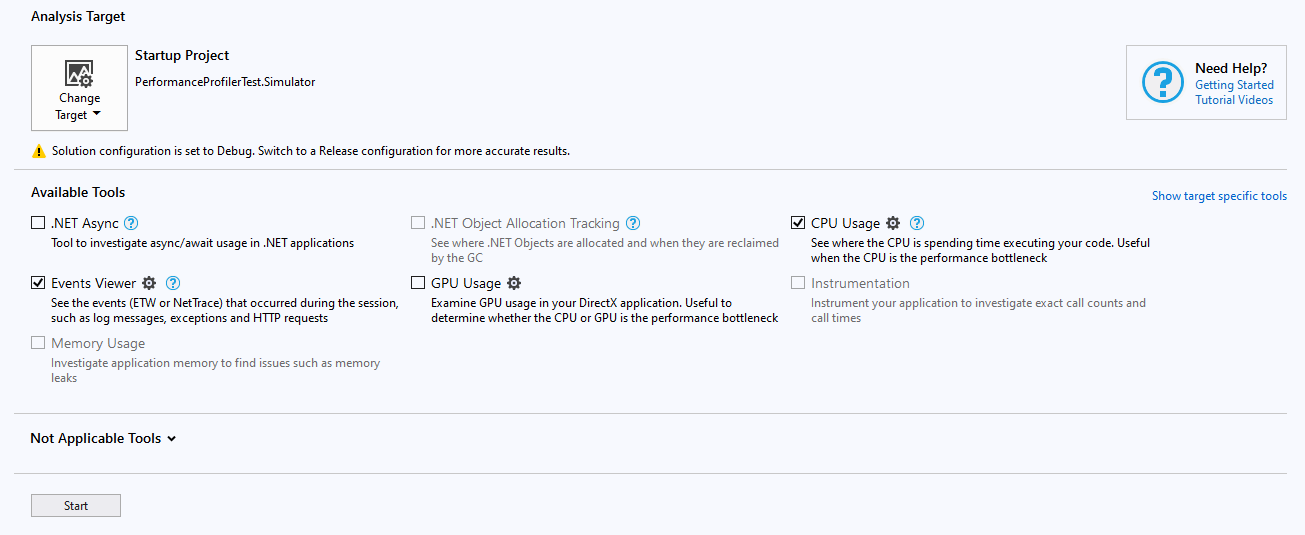
Select profiling tool and click Start. Diagnostics information will be generated after closing the simulator.
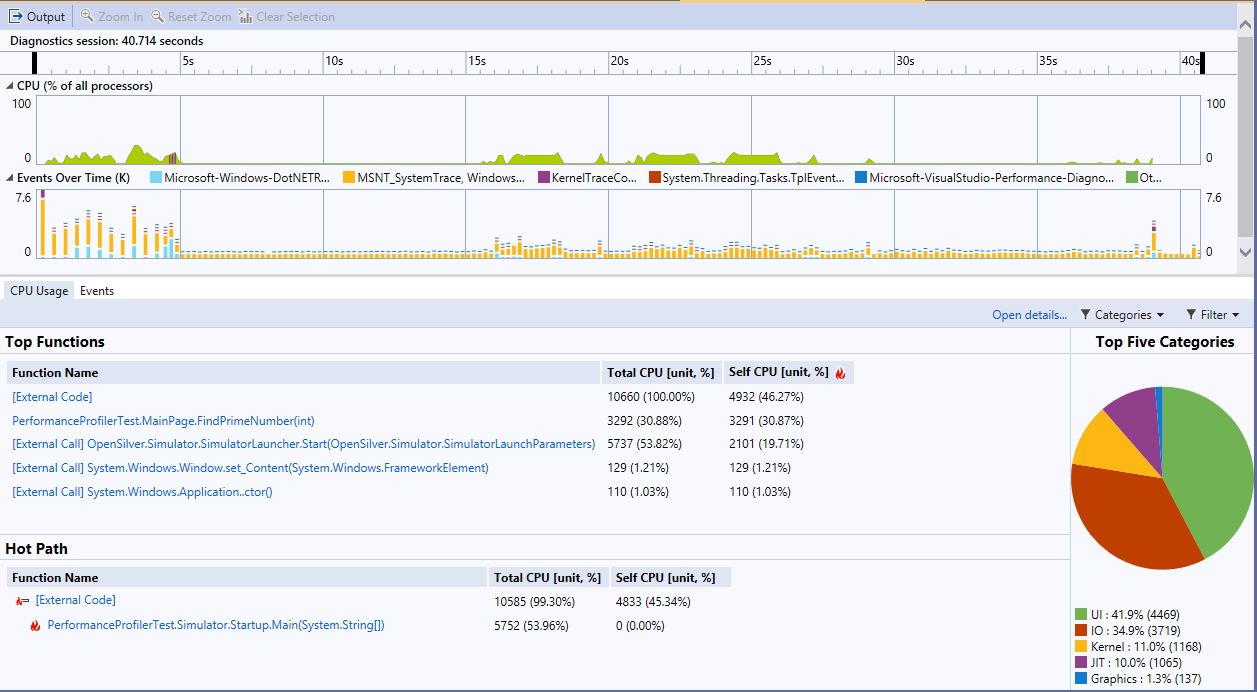
Here are some examples of CPU Usage diagnostics.

4. Specify .pdb files location
If the result doesn't show OpenSilver external calls then most probably profiler couldn't find .pdb files for OpenSilver.
Follow the instructions to specify .pdb files location in Visual Studio. One other option would be to copy OpenSilver.pdb in Simulator Debug folder.
Useful links
This document describes all profiling tools in depth.
Measure app performance in Visual Studio