Use Browser to profile OpenSilver applications
Visual Studio provides different built-in tools for profiling and analysing performance including CPU and memory usage of applications. Here is how to use it in the Simulator project.
However, for technical reasons we can use it only in Simulator. While it will provide a generic idea about performance and heavy running parts, the end goal is to run the applications in Browser and some routines can be slightly different when running on Browser.
Profiling in Google Chrome
All well known Browsers have built-in performance profiler. For this post we are going to use Google Chrome.
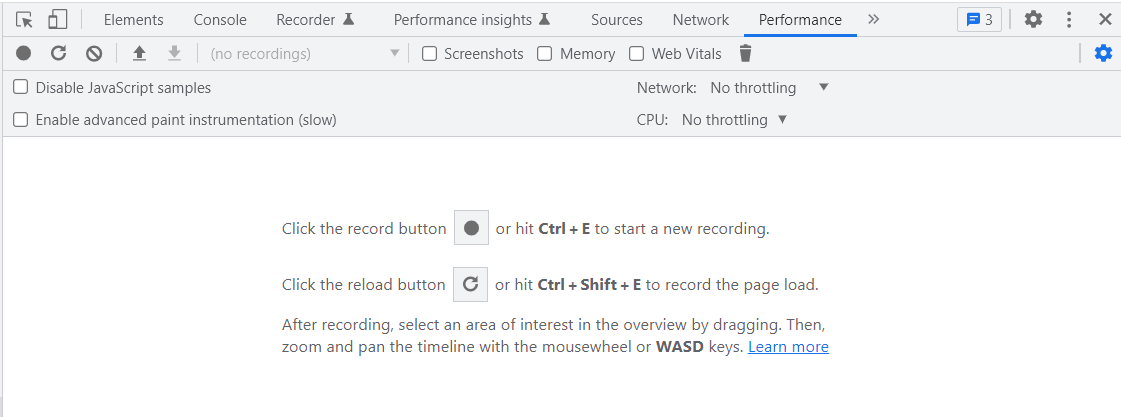
Running the profiler in Chrome is straightforward - just open Developer tools (Ctrl + Shift + I) and navigate to the Performance tab. Now we can use either Reload button to profile application initial load performance or Record button to start/stop profiling as we need to.
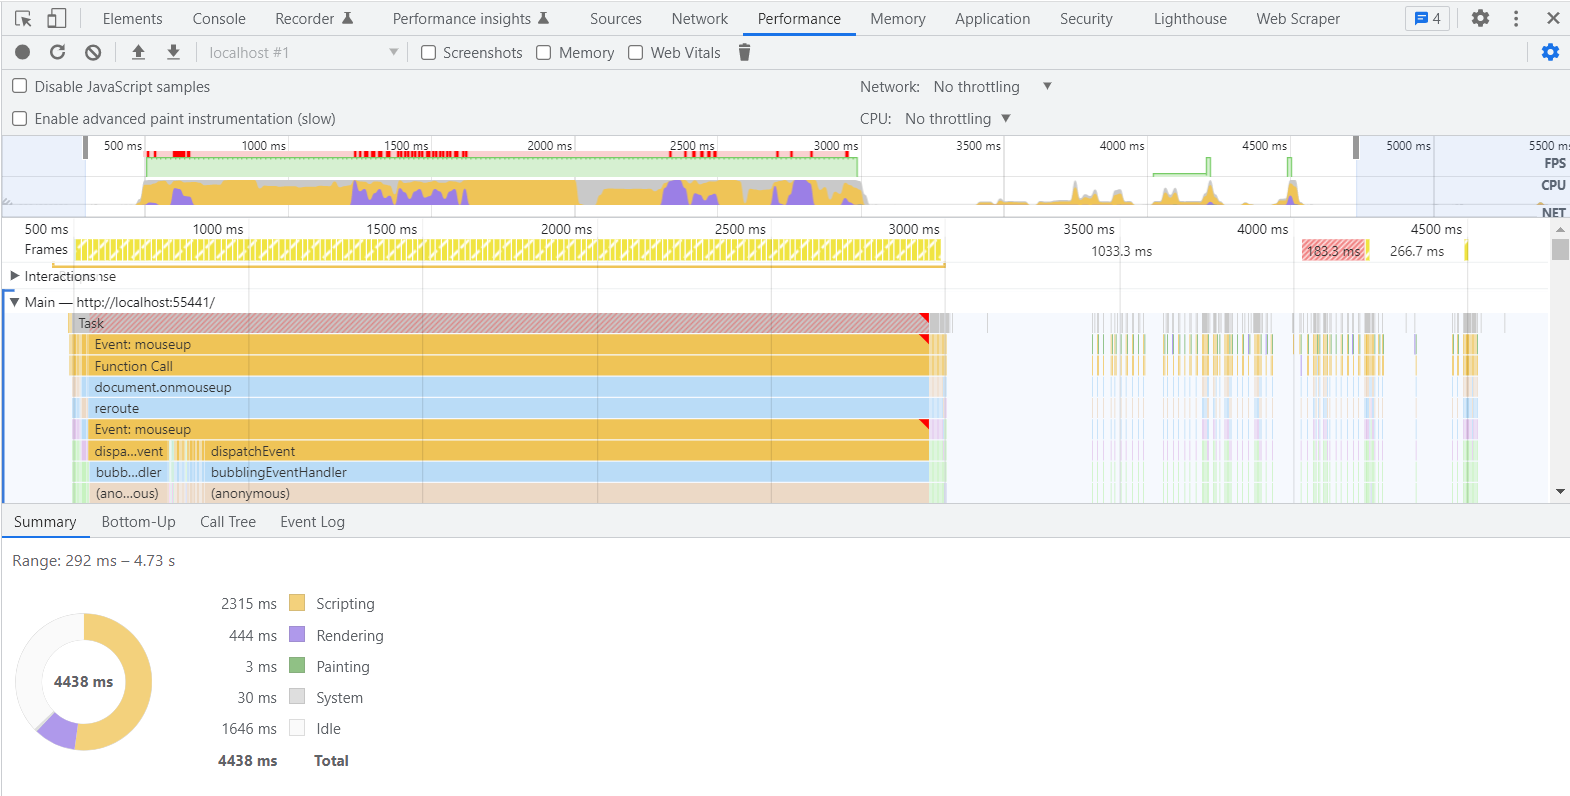
Here is an example of how the result looks like. It shows how much time is spent on Scripting, Rendering etc. And of course it is possible to zoom-in and see detailed information about each particular function.
Decode wasm-function - AOT
One of the challenges that OpenSilver and Blazor applications face is we don't see the C# method names in profiler result but instead a lot of wasm-function's with corresponding numbers.
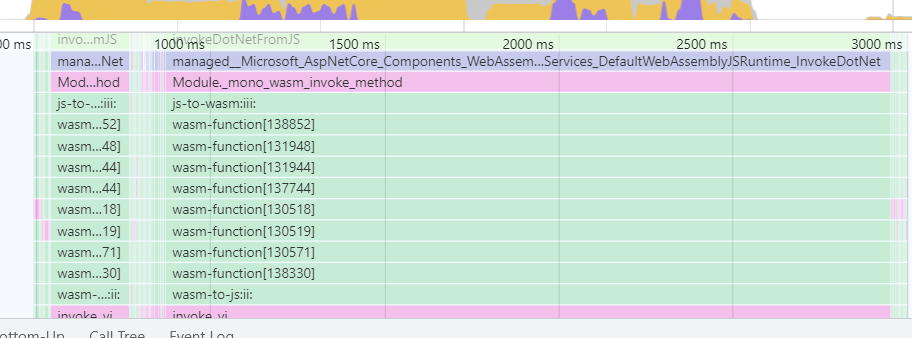
The reason is the method names are stripped during compilation to make binary (dotnet.wasm) smaller.
In AOT mode there are 2 ways to know which particular method corresponds to which number.
1. WasmNativeStrip
The property tells the compiler to not strip method names.
<PropertyGroup>
  ...
  <WasmNativeStrip>false</WasmNativeStrip>
  ...
</PropertyGroup>
WasmNativeStrip is available in .NET6 and .NET7 and works only in AOT mode.
Here is how the result looks like.
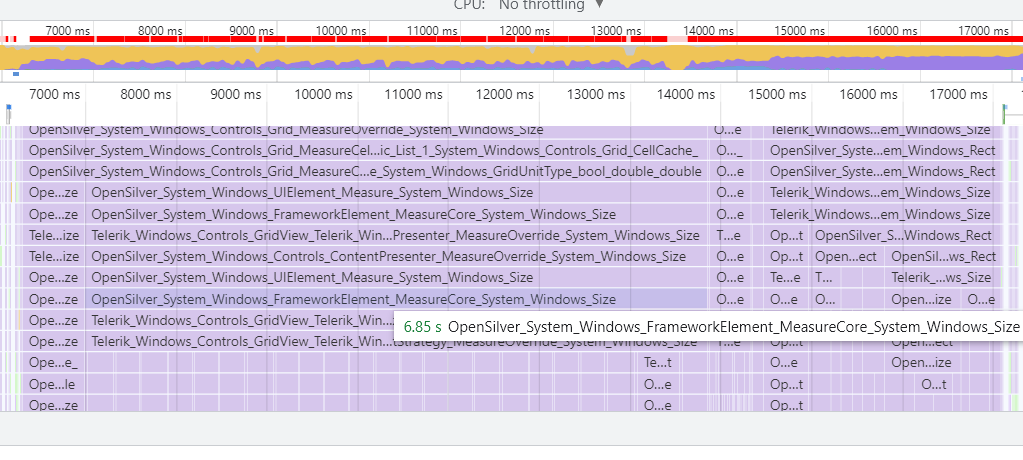
Please note that this will make the binary size almost twice bigger because the function names are constructed using full namespace names.
OpenSilver.System.Windows.UIElement.Measure.System.Windows.Size -> OpenSilver_System_Windows_UIElement_Measure_System_Windows_Size
2. WasmEmitSymbolMap
The property tells the compiler to generate a dotnet.js.symbols file where corresponding method names are listed. This property is more convenient to use in production, because it doesn't have any impact on binary size and dotnet.js.symbols can be just ignored if not needed. So the property can always be enabled.
<PropertyGroup>
  ...
  <WasmEmitSymbolMap>true</WasmEmitSymbolMap>
  ...
</PropertyGroup>
WasmEmitSymbolMap is available starting from .NET7 Preview 5 and works only in AOT mode.
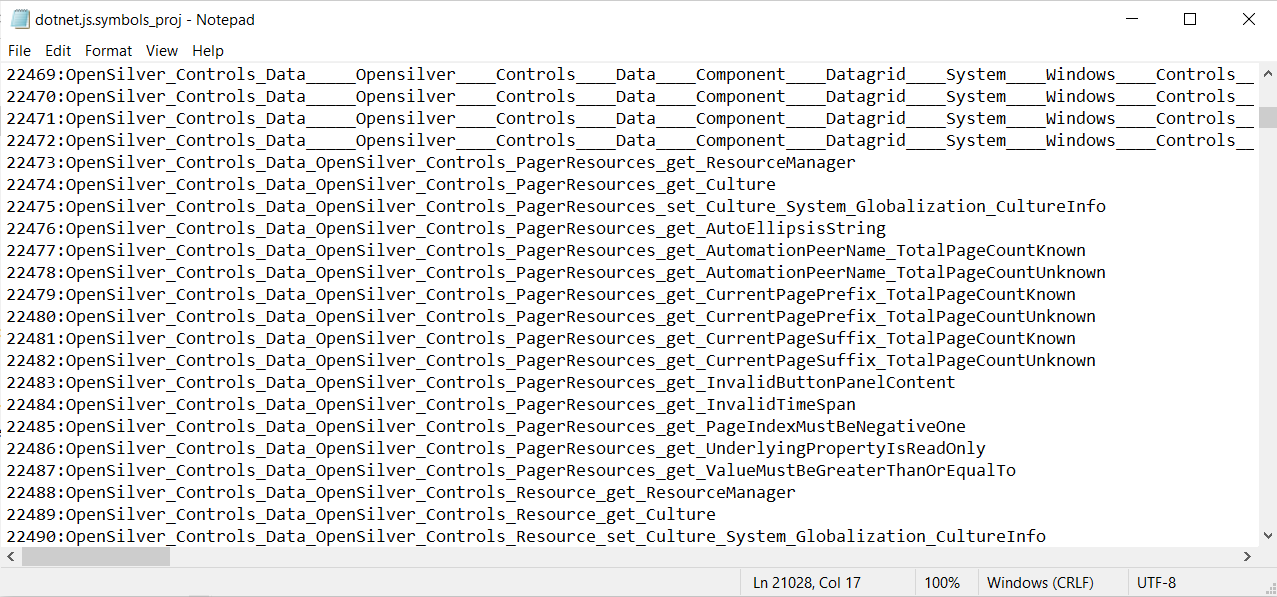
Replacing wasm-function with corresponding methods in profiler result
It might be inconvenient to use WasmNativeStrip for just profiling, taking into account AOT build time. But it is more inconvenient to check the function number then go and check the method name in dotnet.js.symbols. Fortunately Google Chrome allows to save profiling data as a json file and then load it back. (Right click -> Save profile.../Load profile...).
That means we can save the profiling data, replace wasm-function's with method names with a simple script and load it back.
Here is a simple C# code which will handle it.
Dictionary<string, string> funcs = new Dictionary<string, string>();
private readonly string symbols = @"C:\Users\ashot\Desktop\dotnet.js.symbols";
private readonly string profile_json = @"C:\Users\ashot\Desktop\Profile-20220628T182534.json";
private readonly string result_json = @"C:\Users\ashot\Desktop\Profile-20220628T182534_1.json";

private void ReplaceWasmFunction()
{
    using (var reader = new StreamReader(symbols))
    {
        while (!reader.EndOfStream)
        {
            var s = reader.ReadLine();

            string num = s.Substring(0, s.IndexOf(":"));
            string func = s.Substring(s.IndexOf(":") + 1, s.Length - num.Length - 1).Replace("\\", "\\\\");
            funcs.Add(num, func);
        }
    }

    using (var reader = new StreamReader(profile_json))
    {
        string content = reader.ReadToEnd();
        content = Regex.Replace(content, @"wasm-function\[.*?\]",
		    m => funcs[m.Value.Substring(14, m.Value.Length - 14 - 1)]);
        using (var writer = new StreamWriter(result_json))
        {
            writer.Write(content);
        }
    }
}
Decode wasm-function - NON-AOT
It would be much convenient to be able to decode wasm-function's in non-aot mode, since AOT build takes a lot of time.
But is it possible? The short answer is NO.
When running in interprated mode, only mono runtime is compiled to WebAssembly and the C# methods are just being executed by runtime.
Let's assume we have a method Measure
public void Measure(Size availableSize)
{
	...
}
What happens when the method is executed is this (very roughly).
interp_exec_method("Measure", width, height);
So the profiler can see that there is a interp_exec_method function call but the C# method is just an argument and the way mono runtime executes it depends on implementation.
In fact .NET 7 Preview 5 provides dotnet.js.symbols under C:\Program Files\dotnet\packs\Microsoft.NETCore.App.Runtime.Mono.browser-wasm\7.0.0-preview.5.22301.12\runtimes\browser-wasm\native which provides wasm-function numbers corresponding to mono runtime.
Using the above mentioned method we can decode wasm-functions and see what they represent.
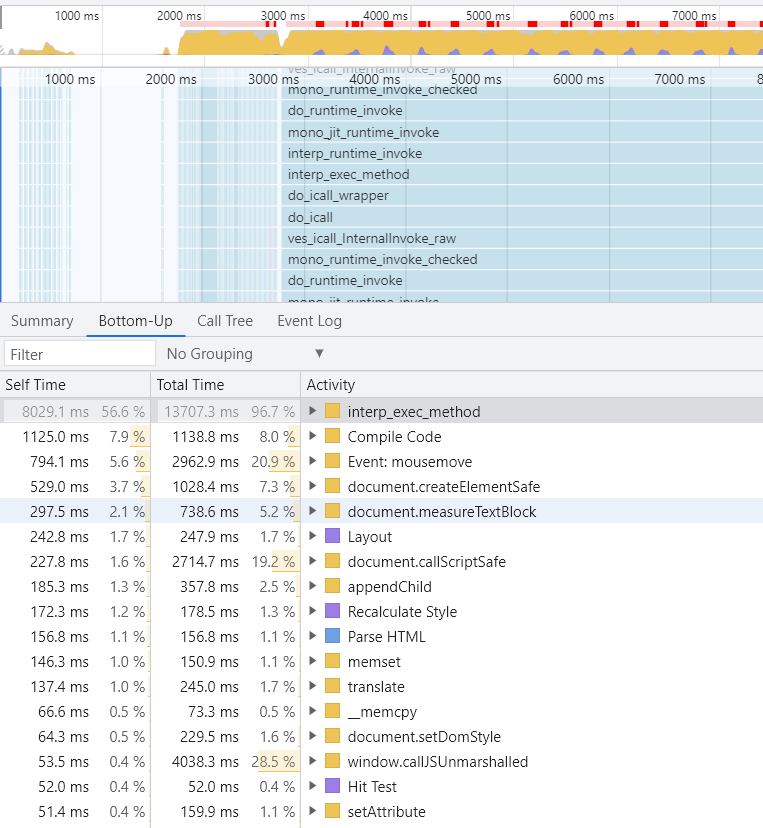
As it can be seen, ~97% of activity is interp_exec_method
